


After, Inc. and Starr Companies Shed Light on How Millennials Purchase and Perceive Extended Service Contracts
Introduction
A lot has been written in the past five years regarding Millennials, who are now 22-37 years old, and represent the largest generation of the U.S. population in terms of labor force and spending power. After, Inc., a global leader in Warranty Analytics Services, and Starr Insurance Companies conducted a research study on Millennials in December 2018. The goal was to better understand Millennials’ preferences and attitudes when it comes to Extended Warranties.
If you could use a quick refresher on the Millennial consumer, we created a Millennial Buyer Profile in the Appendix. It summarizes a typical Millennial’s demographics, advertising preferences and buying habits.
Key points to note for manufacturers:
- Millennials are the largest segment of the population, with nearly $1 trillion in buying power.
- They are highly educated, digitally savvy, and have higher expectations (and lower loyalty) when it comes to brands.
- Millennials are aware of their data being collected and are okay with it being used – with their consent – to understand their individual preferences and provide them with personalized offers and discounts.
- They are wary of traditional advertising and place a higher trust in reviews from friends (through social media), influencers (through YouTube Channels) and fellow customers (on manufacturers’ websites, marketplaces like Amazon, and review websites like Yelp). They will do significant research before they purchase to understand product pricing, quality and options.
Now….on to our research.
Methodology
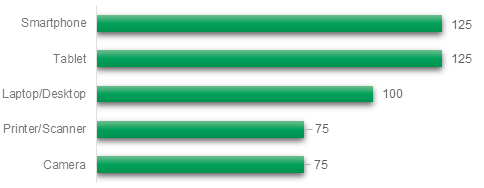
We surveyed 500 Millennials aged 22-37 in December 2018 who had purchased new products in the last six months across five categories (see Figure 1).
Figure 1: Breakdown of products purchased by Millennial participants (N=500)
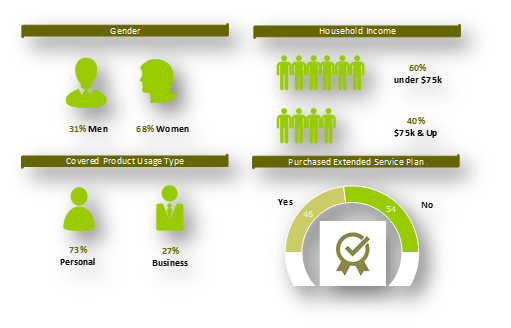
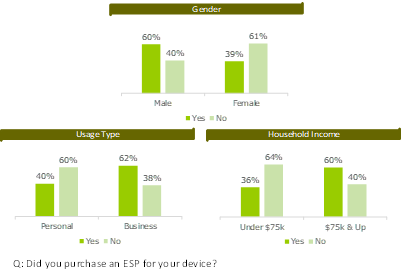
Participants were also segmented by gender, household income, personal vs. business usage, and whether or not they purchased an Extended Service Plan (see Figure 2).
Figure 2: Overview of survey participant characteristics
Key Findings: Product Purchase
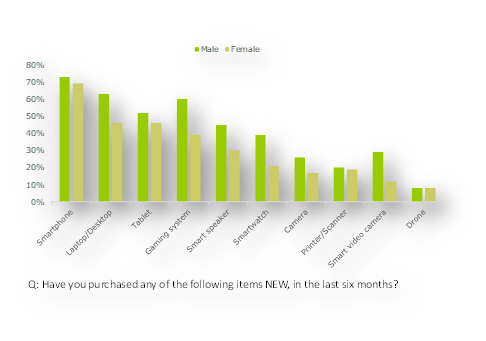
1.) Gender is a factor in product purchase.
- Men and women equally likely to buy smartphones, tablets, printers, drones.
- Men more likely to purchase all other types of electronics measured.
Figure 3: Types of devices purchased by gender in the past 6 months
2.) Household income impacts purchase of most devices.
- Income not a factor in the purchase of smartphones or gaming systems.
- Higher incomes more likely to purchase all other types of devices.
3.) Purchases made at various retailers, depending on the device.
- Wireless carriers dominate sales of smartphones.
- Best Buy is primary retailer for computer purchases.
- Amazon is the retailer of choice for tablets, printers and cameras.
- Wal-Mart closely follows Amazon as retailer for printers and cameras.
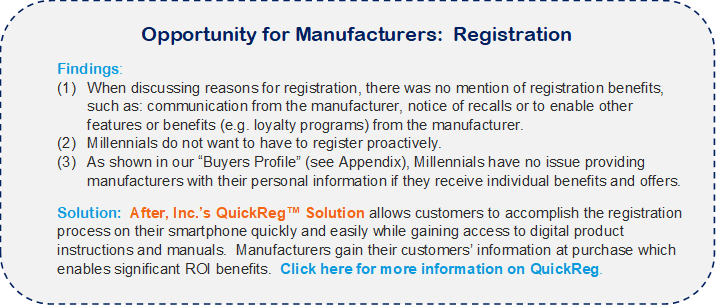
Key Findings: Registration
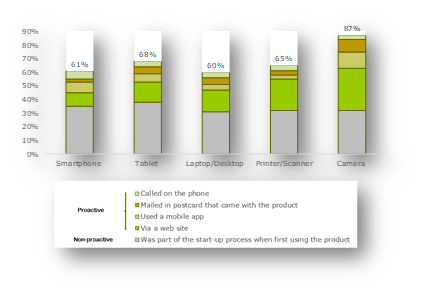
1.) Registration rate is highest on cameras at 87%.
Majority of Millennials register by calling a phone number or via a website.
Figure 4: Registration rates and methods
2.) The #1 reason why Millennials register is because “I always register my products”, 2nd reason being “For easier service in the future, if needed”.
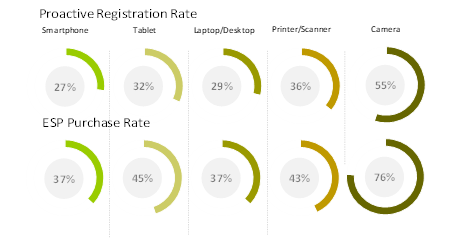
3.) Majority of Millennials do not register “proactively”.
Key Findings: Extended Service Plan (ESP) Purchase
1.) Higher ESP Attach with Men, Higher Income Households, and Business Users.
- Males and higher income respondents are more likely to purchase ESP.
- Business-use devices have higher ESP attach rate.
Figure 5: ESC attach rates by gender, usage type and household income
2.) Highest ESP Attach on Digital and Video Cameras (76%).
- Less than half of other categories purchased ESP: smartphone (37%), tablet (45%), desktop/laptop (37%), and printer (43%).
3.) The higher the device cost, the higher the ESP attach rate.
- ESP attach rate is higher for more expensive products across all categories.
4.) ESP purchase rate is consistent w/ proactive registration rate across all products.
Figure 6: ESP purchase rate across products consistent with registration
Key Findings: Motivations for ESP Purchase
1.) Millennials want to learn about ESP options before or at the time of purchase.
2.) Reasons for ESP purchases differ across products:
- Smartphone – “peace of mind”, “extend product life”, “good value”
- Tablet – “product repair coverage”, “peace of mind”
- Laptop/Desktop – “extend product life”, “high replacement cost”
- Printer/Scanner – “product repair coverage”, “high repair cost”
- Camera – “high repair cost”, “good value”
3.) Reasons for NOT purchasing ESP similar, except for cameras:
- Smartphone/Tablet/Laptop/Desktop/Printer/Scanner – “manufacturer warranty is enough”, “not good value”
- Camera – “rather take my chances”, “above my budget”
4.) Open ended statements provide additional insights:
- Peace of mind important for smartphones, printers and cameras
- Value is important for tablets – consider “no deductible” plans for tablets
- Convenience is important for smartphones/computers – like the monthly payment feature with wireless carriers on smartphones and local repair options for computers
- Positive user reviews very important for computer and camera buyers, less so but still important for tablet buyers
Conclusions & Recommendations
1.) Millennials behave similarly to the rest of the population with respect to ESPs, except they have a greater tendency towards research in advance. To better meet their needs, manufacturers should:
- Post ESC information on their websites.
- Allow customers to provide reviews whether on your social media platforms or online marketplaces (make sure to monitor).
- Focus sales efforts on offers at point of sale (both online and in store).
2.) Millennials want customized offers, or options that they can choose from. Manufacturers could consider offering:
- Custom plans by product
- More benefits during the MFG warranty
- Lower cost plans to attract lower income buyers
- Easy pay options
- “Light business” or “light commercial” plans
After, Inc. has been a leader in Warranty Analytics, Warranty Marketing and Warranty Program Management since 2005. If you would like a copy of the Millennial Research Study, click here. If you have follow up questions, reach out to Dan Hulkower, SVP Business Development, at dhulkower@afterinc.com.
If you’d like to learn more about our Warranty Services, including QuickReg™ please reach out to us info@afterinc.com. We look forward to hearing from you.
Appendix: The Millennial Consumer Buyer Profile
The buyer’s profile below gives you a high level understanding of a typical Millennial’s demographics, technology use, advertising preferences and buying habits.
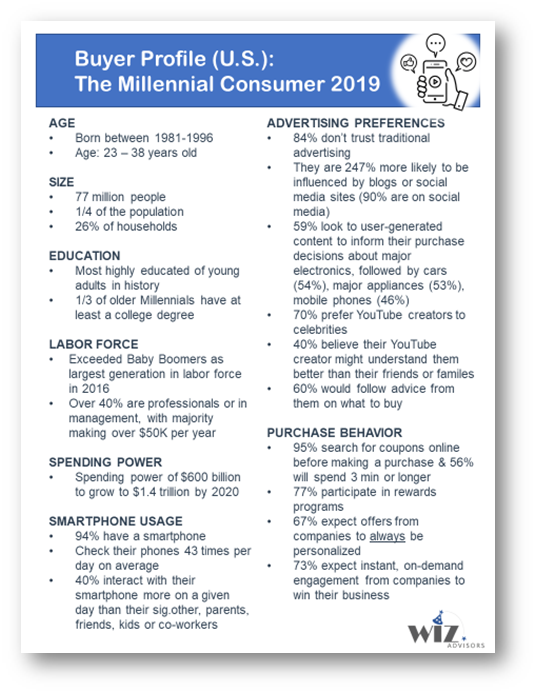
Sources: Pew Research Center, Nielson, Accenture, Pew Internet, Think with Google, DMN, AIMA, Salesforce.com.