


Warranty Risk Management 101: Part 2- Risk Structures
Introduction
In Part 1 of this Series, we introduced you to Warranty Risk Management, explained the importance of cost per unit (CPU) calculations as a central variable in accurate claims forecasting (something we will discuss in detail in Part 3 of this Series), and provided definitions of thirteen key Warranty Risk Management terms. In Part 2, we will discuss different structures that manufacturers and retailers can employ to control risk and manage liabilities related to their warranty programs. While there are many ‘hybrid’ risk structures, we’ll suggest 4 different ‘categories’ – but please note there are additional alternatives. This section is important because understanding the various types of structures and some of the pros and cons of each will allow you to make the right decision – both short and longer term – for your company.
Four Categories of Risk Structures
The four risk structure categories are shown in the graphic below. The decision of which structure to choose depends on your company’s internal expertise, strategic goals, appetite to participate in risk, and what you know/don’t know. We like to think of risk structures along a continuum from lowest to highest control and highest to lowest costs.
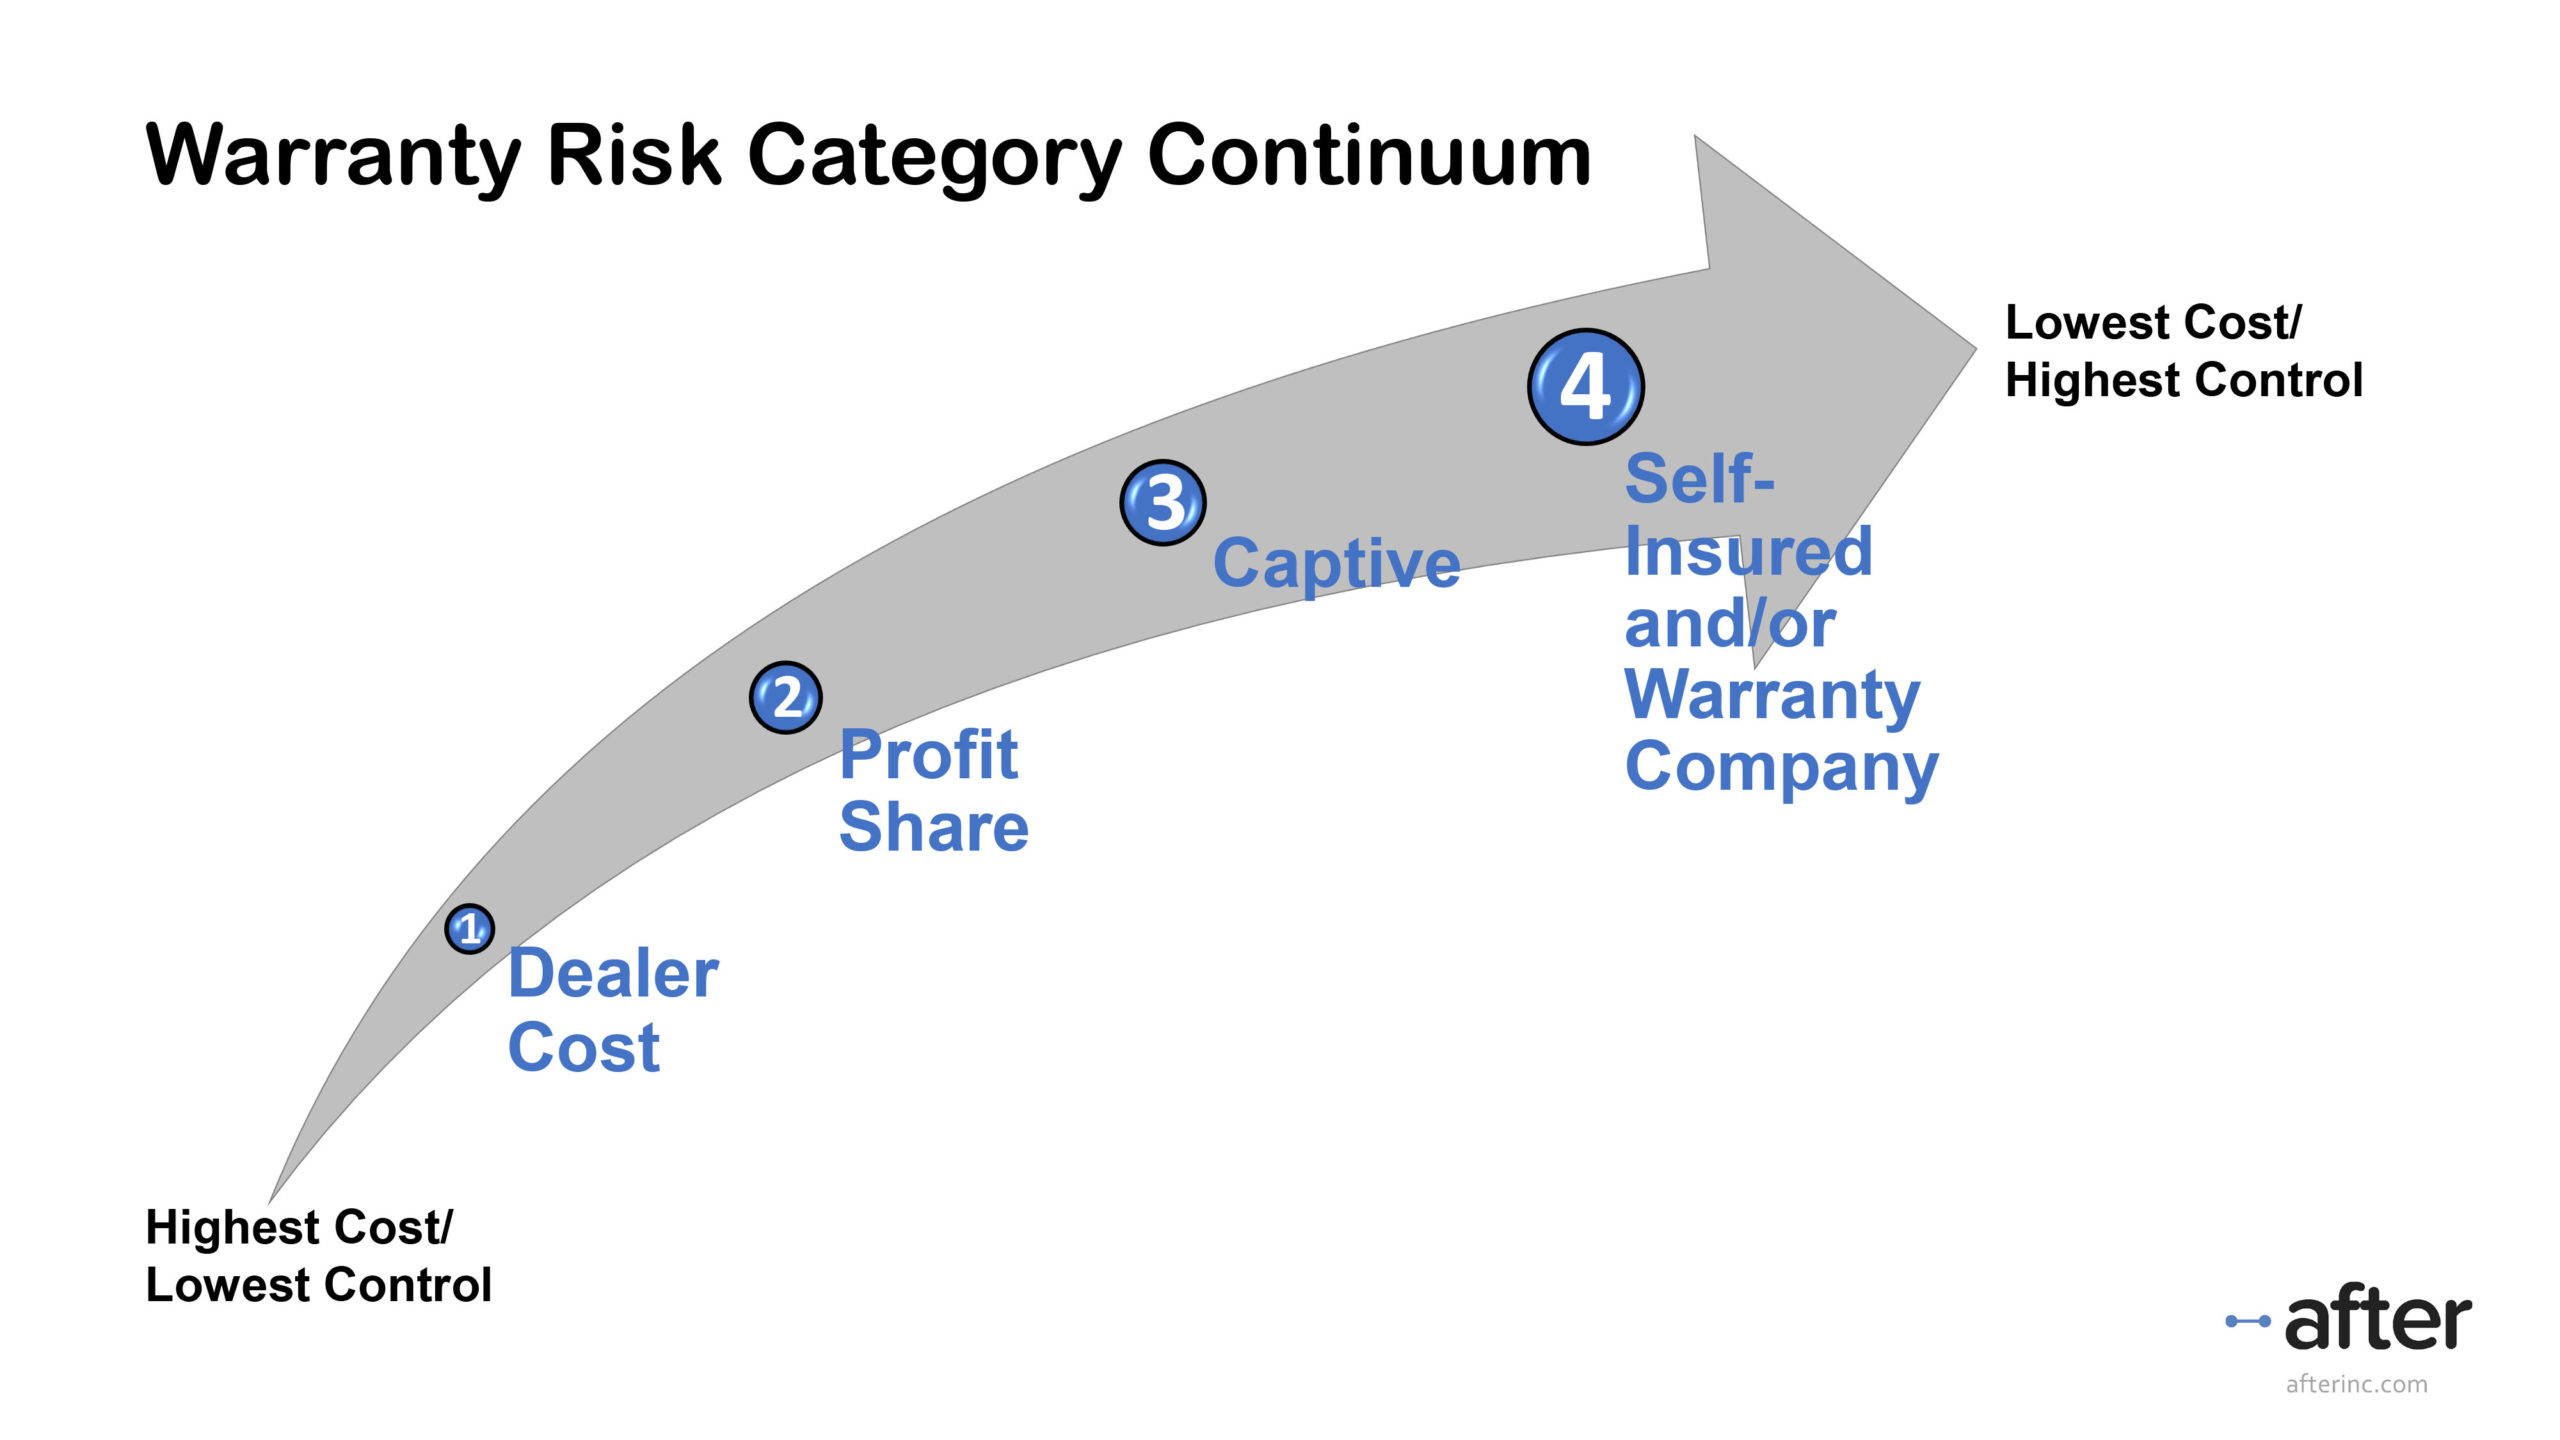
Before we address each of the risk categories, let’s touch on the two noted variables:
- Cost: This refers primarily to the cost of risk transfer. These costs can include items like carrier risk fees, safety margins, premium insurance tax, underwriting profits, additional carrier margins, etc.
- When the costs of risk transfer are higher, there are other implications too. For example: higher costs of risk transfer result in higher retail pricing – and this is often a multiplicative impact.
- Control: This refers to control over various elements of the program like pricing, premium/rates, feature/benefit changes, timing of changes, costs of risk transfer, claim administration, etc.
It is important to note that as you move to structures that have ‘higher control’ you must also have appropriate risk analytics/oversight. The primary reason is that, as you move up the continuum, you are taking on more responsibility – or participating at a higher level – in the risk itself. Don’t let this discourage you – quite the opposite! With the right risk analytics/oversight your program will be more stable, less costly, generate higher financial returns, and ensure a better customer experience. We’ll talk more about this in Parts 3 and 4.
As you contemplate the ‘right’ structure please understand that, based on several variables, you may start with one risk structure, but have future plans to move up the continuum – we refer to this as a Risk Roadmap. This is important, as a good roadmap leads to a more cohesive strategy that can be executed over a shorter time as you learn and become more knowledgeable about the details of your program.
Below is a table that summarizes four risk structures and some pros and cons of each. You can download and print the table for your reference here.
| Definition | Pros | Cons | |
|---|---|---|---|
| Dealer Cost | Manufacturer or Retailer outsources all underwriting and potentially claim administration to an insurance company and third-party administrator (TPA). Some insurance companties and TPA’s are vertically integrated so they do both. Insurance company sets premium based on their calculations plus risk transfer costs and margin. Manufacturer or retailer includes their own markup on top of the dealer cost and sells contracts. | Simple structure. Transfers risk – risk is off the books of the Manufacturer or Retailer. Recognize all revenue when contracts are sold. Positive marketing spin of a program backed by a highly rated carrier. This may be a good structure for brand new programs or programs where there is little claim information available. This may also be a good place to start if ‘you don’t know what you don’t know’. | Surrender cash. May have no visibility into claims data. Limited flexibility on pricing. Carrier can raise premiums at its discretion according to contractual agreement. No real insight into underwriting performance. No share of underwriting profits. Surveys consistently demonstrate consumer preference for OEM and Retailer backed programs. |
| Profit Share | Similar to ‘Dealer Cost’ in many ways, but the carrier agrees to share underwriting profits. Profit share calculations are generated by the carrier according to their actuarial analysis and premium earning patterns. Claim administration may reside with the manufacturer or retailer but insurer controls approval. Amount and timing of profit share is negotiable depending on several variables, including what you know/don’t know. | Share in underwriting profits can be large. May include more transparency into claims patterns and resulting rates. Risk transfer – risk is off the books of the Manufacturer or Retailer. Recognize all revenue when contracts are sold. Positive marketing spin of a program backed by a highly rated carrier. | Actuarial analysis is often significantly flawed, leading to higher costs, rates, and pricing than necessary. Smaller programs (<$1-2M annual premium) are often not eligible for profit share arrangements. Without cutting-edge risk oversight, the manufacturer or retailer will not understand hidden optimization opportunites. |
| Captive | Manufacturer or retailer creates a wholly owned captive insurance company to hold its company-wide risk exposure. Can include warranty risk as well as: employee healthcare insurance, workers compensation, product liability, professional liability, etc. The risk is often “fronted” by a carrier who issues a Contractual Liability Insurance Policy (CLP or CLIP) on behalf of the captive. Extended Warranty Programs are a good way to diversify a captive portfolio – often not something to create a captive for on its own. | Tailored coverage to meet manufacturer’s specific needs and risk profile. Significantly lower risk transfer costs – if fronted, results in a much lower ‘risk fee’. Retains 100% of underwriting profits and investment income on unearned premium. Control of investment decisions. Immediate income recognition if fronted. Can have positive tax implications. More control over program elements such as pricing, features/benefits, timing of changes, etc. | A more complex structure. Requires insurance and legal/compliance expertise. Requires new-age analytic and modeling capabilities to take full advantage of the benefits of this structure (this ‘con’ could also be listed on the ‘pros’ side!) |
| Warranty Company and/or Self-Insurance | Manufacturer or Retailer sets aside a certain amount of money internally to cover claims. Generally, an insurance carrier is only used if required by various regulatory bodies. | Simpler structure Control cash – no payment to insurance company or captive. Much more flexibility on pricing, features/benefits, timing, etc. Lower costs, higher margins. | Retain risk. Potential compliance risk May not be a core-competency Without carrier involvement, income may be deferred over the life of the contract. |
Early in this article, we mentioned one of the considerations in choosing a risk structure is ‘what you know or don’t know’. Learning what you don’t know is difficult unless you have a strategic risk partner without conflicting interests. We discussed this at a high level in Part 1, and you’ll learn more about this in Parts 3 and 4.
To learn more about After, Inc.’s Warranty Analytics & Risk Management Services, please visit http://afterinc.com/warranty-analytics-solutions/.
After, Inc. (www.afterinc.com) has been offering Warranty Analytics, Program Administration and Risk Management Consulting – including captive set-up and management – to top tier manufacturing clients for over fifteen years. If you have any questions about Risk Management, feel free to reach out to us at http://afterinc.com/contact/. We look forward to hearing from you!