


A Brief History of Predictive Analytics – Part 3
A Brief History of Predictive Analytics – Part 3
The players, events and innovations that propelled the analytics industry from the 1940’s to today
This is part 3 of a 3-part blog, where we outline the history of Predictive Analytics. Given it is such a hot topic with our warranty manufacturing clients – as well as just about any company looking to drive higher efficiency, profitability and customer satisfaction – we thought a quick history lesson might be warranted (pun intended). Part 1 takes you from the 1940’s – 1950’s, Part 2 from the 1960’s – 1990’s, and Part 3 from the 2000’s – today.
The 2000’s – Present: Data, Data, Everywhere
- Key Players:
- Businesses of every size, industry and geography
- Significant Events:
- Data warehouses spur M&A activity amongst large transactional and demographic data providers and unique data sources became organizations’ most valuable assets (e.g. Equifax purchases Polk Direct Marketing in 2000 to enable targeted credit offers based on demographics).
- Social media platforms – Facebook (founded in 2005), Instagram, Twitter, LinkedIn – puts the consumer in charge of what it wants to share, read, comment and “like” – rise of engagement measurement tools.
Figure 1 – Social Media Platforms

- Google Analytics is launched in 2006.
- Amazon launches Amazon Web Services (AWS) S3 in 2006 and gains widespread recognition as the top cloud storage provider; companies need only pay for the storage they use, typically an average of consumption during a month, making it an operating vs capital expense and much less expensive.
- Web 2.0 requires tools that focus on flexibility, agility and immediacy for businesses to track competitor offerings, analyze campaigns and make changes in real-time, capture customer reactions to product launches, and determine which devices and when customers prefer to interact with brands.
- “Software verticalization” – the development of industry-specific analytic tools (like warranty analytics software) which contributes significantly to the increased adoption of analytics across all industries.
- Natural language processing (NLP) makes it possible for computers to read text, hear speech, interpret it, measure sentiment and determine which parts are important (e.g. Amazon’s “Alexa”).
- Self-service visualization software makes it possible for business users to utilize data analytics tools without the need for IT professionals.
Figure 2 – Various Forms of Data Visualization Graphics
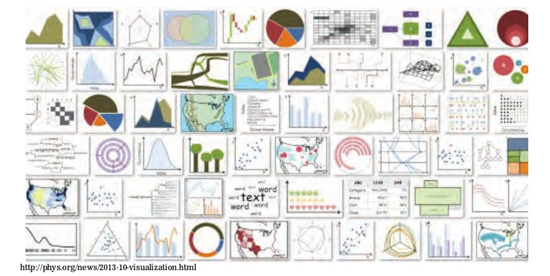
Source: “Data Visualization Workshop” for General Assembly, Slideshare, Hunter Whitney, Feb 2015.
- Internet of things (IoT) emerges as the network of physical devices, vehicles, home appliances, and other items embedded with electronics, software, sensors, actuators, and connectivity which enables these things to connect, collect and exchange data.
- AI is utilized to develop products that are more accurate, engaging and efficient for businesses and consumers.
- X-Box One and X-Box 360 provide 3-D body-motion interface that uses algorithms developed from AI research.
- iPhone’s SIRI is also based on AI algorithms – “intelligent personal assistant”.
- Industrial robots are used in factories to drive production line efficiency.
- Google’s autonomous car project starts in 2009 led by Sebastian Thrun, co-inventor of Google Street View; by 2014 Google reveals 100% autonomous car with no steering wheel gas pedal or break.
- By 2013, major automotive companies including General Motors, Ford, Mercedes Benz, BMW, Nissan and others are all working on their own self-driving car technologies
- Innovations:
- NoSQL Databases – a particular group of databases that share the following characteristics: non-relational (data set too large for normal storage/retrieval), open source, schema-less (no fixed database structure, flexible and supports agile development), horizontally scalable (clustered environment where data is separated across multiple computers where each performs a task without having to share memory), no standard query language, lack of adherence to SQL database principles (ACID – Atomicity, Consistency, Isolation, Durability).
- Cloud storage – based on highly virtualized infrastructure and is like broader cloud computing in terms of interfaces, near-instant elasticity and scalability, multi-tenancy, and metered resources; can be utilized from an off-premises service (Amazon S3) or deployed on-premises. Providers are responsible for keeping the data availableand accessible, and the physical environment protected and running.
- Cloud computing – the on-demand delivery of compute power, database storage, applications, and other IT resources through a cloud services platform via the internet with pay-as-you-go pricing.
- Natural language processing (NLP) – a branch of artificial intelligence that helps computers understand, interpret and manipulate human language.
- Text analytics – goes hand in hand with NLP – it counts, groups and categorizes data to extract structure and meaning from large volumes of content; also derives new variables from raw text to use as inputs in predictive models.
- Artificial intelligence – the theory and development of computer systems able to perform tasks that normally require human intelligence, such as visual perception, speech recognition, decision-making, and translation between languages.
- Machine learning – a field of artificial intelligence that uses statistical techniques to give computer systems the ability to “learn” from data, without being programmed.
- Artificial intelligence (AI) algorithms – algorithms that are capable of learning from data; they can enhance themselves by learning new heuristics ( “rules of thumb”, that have worked well in the past), and can themselves write other algorithms.
Conclusion
As our 3-part blog illustrates, predictive analytics did not just appear overnight. Its principles date back to the early 1940’s, and its evolution spans the last 75 years. We wanted to share our knowledge with you, as we believe that understanding the history of predictive analytics can provide a more informed lens to consider current trends and opportunities and how they might be employed in your organizations.
For more information on After, Inc.’s Predictive Warranty Analytics Services, click here, or feel free to contact us by telephone (800.374.4728) or email (info@afterinc.com).
Sources:
- FICO Blog, “Infographic: The Analytics Big Bang”, 2013.
- The History of BI: The 1980’s and 90’s”, dataconomy.com, Furhaad Shah, Editor, July 3, 2014.
- “Evolution of Analytics – a Timeline Perspective”, slideshare.net , Saurabh Banerjee, Sapient Global Markets, July 2015.
- “Data Science, Data Scientists, and the Evolution of Analytics”, Enterra Solutions Blog, Stephen DeAngelis, June 30, 2014.
- “Gartner Says Business Analytics is a Top Business Priority”, Press Release, October 21, 2014.
- “Impact of Big Data on Analytics”, slideshare.net, CapGemini, July 11, 2014.
- “A Brief History of Big Data”, dataversity.com, Keith D. Foote, December 14, 2017.
- “A Brief History of the Data Warehouse”, dataversity.com, Keith D. Foote, April 19, 2018.
- “History of Business Intelligence” betterbuys.com/bi, Justin Heinze, September 26, 2014.
- “What is Cloud Computing”, Amazon website, AWS Cloud Computing Services.